
Reports Explanation
| Category | Explanation |
| Overview | Overview allows you to quickly assess your operational status and compare passes sales with class reservations. Pass sales: Total sales amount of all pass, including memberships. (Excludes unpaid pass) Class revenue: Total revenue generated from all classes. Note: For unlimited passes, please refer to membership calculations. Pass membership: Refers to any unlimited usage plan. For example, for a monthly unlimited pass priced at NT$3,000: Daily membership income is calculated as NT$3,000 divided by 30 days, resulting in NT$100/day or NT$700/week, and so on. Instructor salary (Including upcoming classes for easier expense estimation by the business) Pay Per Session: Money received for classes and appointments paid for directly without a pass, including their add-ons. Counted on the day the payment is received. Equipment: Money received for standalone equipment hires and for paid equipment booked with or added to a class or appointment. Counted on the day the payment is received. Total = Class revenue + Pass membership + Shop + Pay Per Session + Equipment − Instructor salary. |
| Passes | Pass Sales overview: Provides an overview of pass sales, including comparisons of order quantity and customer count, along with visibility into unpaid items for customers. Pass sales: Total sales amount of all pass, including memberships. (Excludes unpaid pass) Active pass: Pass that have been activated. Memberships: Refers to any plans with unlimited. For example, for a monthly pass priced at NT$3,000 with unlimited: Monthly fee of NT$3,000 divided by 30 days equals daily membership revenue of NT$100, weekly revenue of NT$700, and so on. Unused passes: Passes that have been activated and are not expired. (Note: Unused = Deferred revenue, Used = Actual revenue) ※Date Filter Instructions※ 1. The activation date of the pass must fall within the selected date range. 2. Classes that occur before the end date of the query and have not yet been counted will be included in the uncounted class total. Expired passes: Expired within this date range. Refunds: all refunded pass records. |
| Instructor | Classes offered: Total number of classes provided, excluding canceled classes. Customer attendance: Number of customers attending the classes. No attendance: Number of customers who reserved but did not attend the classes. Class filled percentage: Attendance count for classes ÷ Capacity count = Class filled percentage. Instructor salary: Total salary for all classes provided by instructors within the specified date range. |
| Class attendance | Classes offered: Total number of classes provided, excluding canceled classes. Customer attendance: Number of customers attending the classes No attendance: Number of customers who reserved but did not attend the classes. Class filled percentage: Attendance count for classes ÷ Capacity count = Class filled percentage. |
| Shop | Shop items sold: The sum of the quantities of items sold in the store. Shop sales: The total number of transaction orders for products. Shop customers: The count of unique customers who completed transactions. (Each customer is counted only once) Types of Items: The number of unique product types sold. (Each product type is counted only once) |
| Equipment | Hires: The number of standalone equipment hires, counted on the day they take place. (Excludes cancelled hires) Units hired: The total number of units in those hires. Hours hired: Each hire's length multiplied by its units. Customers: The count of unique customers who hired. (Each customer is counted only once) Paid: The money received for those hires. Booking add-ons: Paid equipment booked with or added to a class or appointment booking. Outstanding: What is still owed on those hires, such as the balance after a deposit. Use the Equipment filter to view one item. |
| Payment method | Number order: The total number of transaction orders for passes and products. Unique customers:The count of unique customers who completed transactions. (Each customer is counted only once) Number passes sold:The total quantity of passes sold. Passes transferred:The number of passes that have been transferred. Shop items Sold:The sum of the quantities of products sold in the store. Shop revenue:The total sales revenue from products. Bookings:The number of classes, appointments and equipment hires paid for directly without a pass. Booking sales:The money received for those bookings, including add-ons and paid equipment on a booking. |
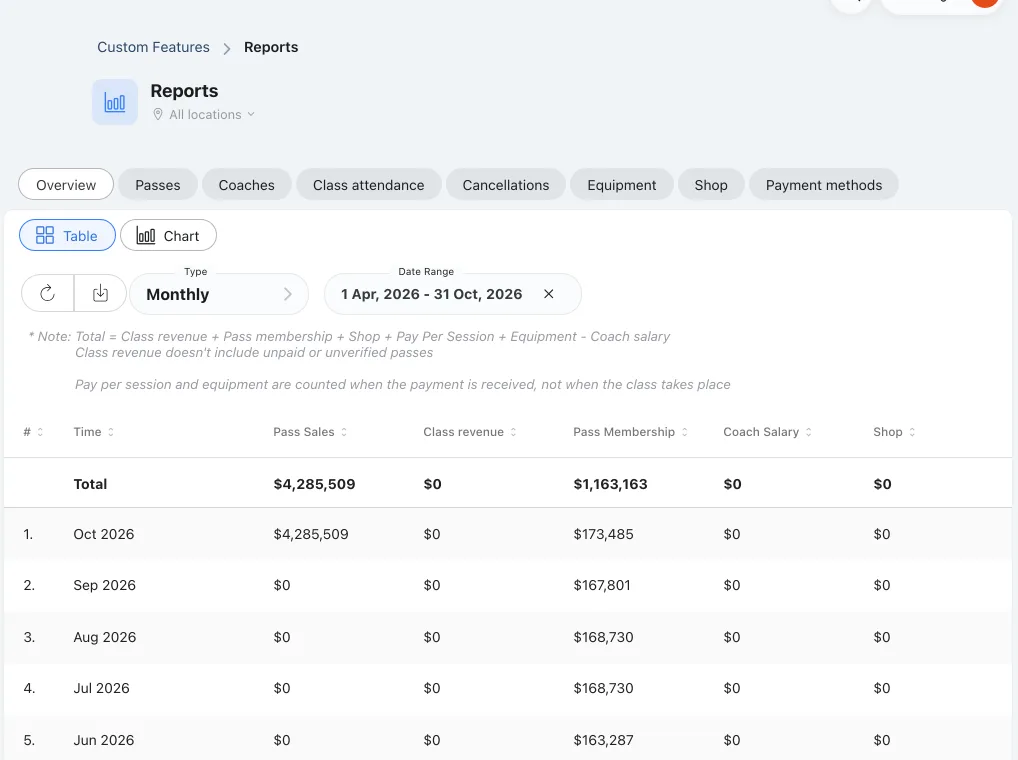
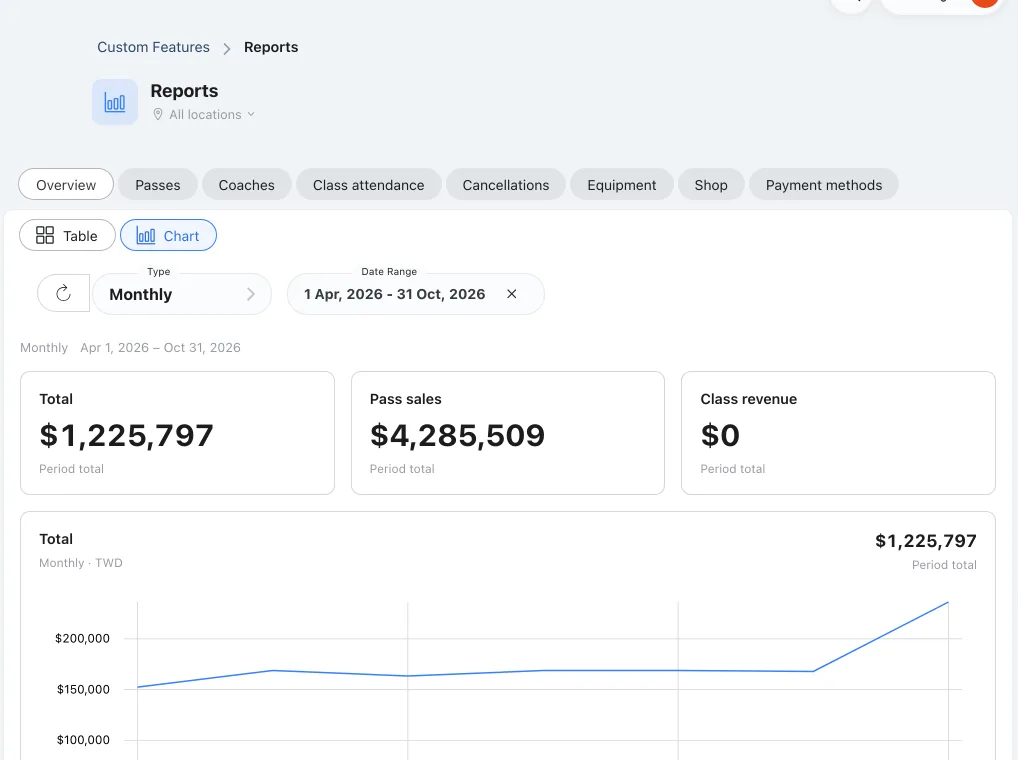
Example of Reports Date Setting Display:
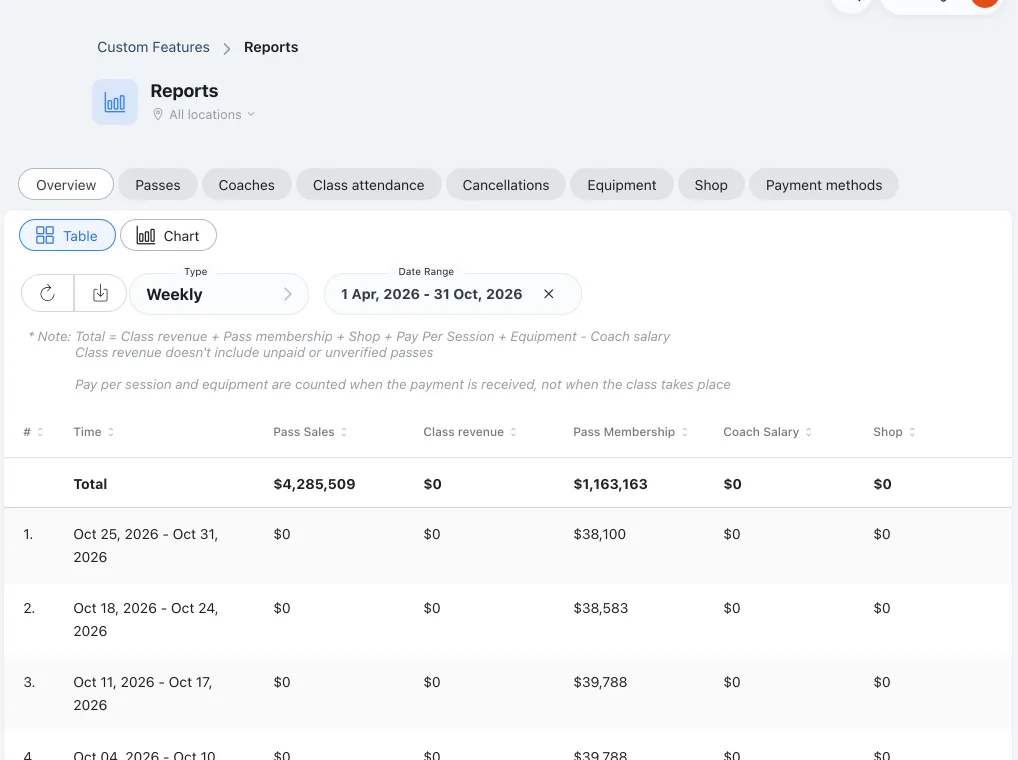
FAQ: If I delete a completed class from the “Schedule,” will the past class records still appear in the Reports?
We don't recommend deleting completed classes. Deleting a class will also remove the related past booking records and data from the Reports.Equipment Report: Filter by Equipment
The Equipment report shows your equipment hire figures, including hires, hours, customers, money received and money still owed.
[Instructions]
- Open Reports and select the Equipment report.
- In the report table's filters, open the Equipment dropdown. It lists your studio's equipment items by name.
- Choose one item to narrow the report table to that item only.
- Clear the Equipment filter to show all equipment again.
The Chart view has the same Equipment filter, so you can chart one item at a time. If the list cannot load there, the chart still shows all equipment.
Troubleshooting: If the Equipment filter list is empty, check that equipment items have been added for hire, then reload the page.
Equipment Report: View the Hires Behind a Figure
In the Equipment report table, you can open a list of the individual hires that make up any row or the total.
[Instructions]
- Open Reports, select the Equipment report and open the Table view.
- Click any row, or the total, to open a details window listing each hire behind that figure.
- Check the filter label at the top of the window. It shows the item you filtered the report by, or All equipment when no item is selected.
- Type a customer name in the search box to find a hire quickly.
What each hire shows:
- Time: The date and time of the hire.
- Duration: How long the hire lasts, in hours and minutes.
- Equipment: The item hired.
- Units hired: The number of units in the hire.
- Customer name, Customer email and Custom ID (a dash is shown when there is no custom ID).
- Paid: The money received for the hire.
- Outstanding: What is still owed on the hire, worked out as the full hire price minus what has been received.
Tip: If a search returns no results, try typing the customer name in lowercase letters.
Reading the Chart View
Most reports have a Table view and a Chart view. The Chart view gives each figure its own chart instead of one combined chart with a legend, and it covers the whole date range you choose rather than only the last 12 periods. Decimal values, such as part hours, are kept.
[Instructions]
- Open Reports, choose a report and open the Chart view.
- In the filter bar at the top, choose Type (Daily, Weekly or Monthly; Monthly is the default) and a date range. Clearing the date range restores the default dates.
- Use the report's own filters if needed (see the table below). The chart reloads automatically when you change a filter, or you can click the refresh button.
- Check the period line under the filters. It shows the period type and the dates covered.
What the Chart view shows:
- Summary cards: Three cards show the report's first three figures. Each card is labelled Period total (the whole selected range added up) or Latest period (the most recent period's value, with its date). Latest period is used for customer counts, active or snapshot counts and percentages, so these are never added up. Hours and points show a unit label.
- Chart cards: One card for each figure, showing its name, the period type, the unit and its value. The first card is full width and taller. Each chart shows bars or a line automatically. A figure with no data in the selected range does not get a chart.
- Missing data: If some periods have no data, the chart says Some periods have no data, and a period total shows a dash (—) instead of a number.
| Report | Filters in the Chart view | Figures charted |
| Overview | Type and date range only | Total, Pass sales, Class revenue, Pass membership, Pay Per Session, Equipment revenue, Instructor salary, Shop profit |
| Pass sales | Pass | Pass sales, Passes sold, Number orders, Unpaid pass sales, Unique customers, Transferred |
| Active passes | Pass | Active passes, Unactivated passes, Number customers |
| Memberships | Pass (memberships only) | Membership revenue, Unpaid membership revenue, Number memberships, Number unpaid memberships |
| Expired passes | Pass | Passes expired, Unique customers |
| Refunds | Pass | Refund amount, Passes refunded, Points refunded, Classes refunded, Unique customers |
| Instructor | Instructor | Classes offered, Customer attendance, Class filled percentage, No attendance, Penalty cancellations, Instructor salary*, Cancellation revenue* |
| Class attendance | Class, Instructor | Customer attendance, Classes offered, Class filled percentage, No attendance, Penalty cancellations, Class revenue*, Cancellation revenue* |
| Cancellations | Cancellation type (All, Allowed or Penalty cancellations), Class, Customer | Total cancellations, Allowed cancellations, Penalty cancellations, Penalty charged, Penalty revenue |
| Shop | Shop item group | Shop profit, Total sold price, Total cost price, Shop items sold, Shop sales, Shop customers, Shop items unique |
| Payment method | Payment method | Pass sales, Booking sales, Shop revenue, Number orders, Bookings, Number passes sold, Shop items sold, Unique customers, Passes transferred |
| Equipment | Equipment | Paid, Hires, Hours hired, Booking add-ons, Outstanding, Units hired, Customers |
Instructor and Class attendance permissions: Staff without permission to view other instructors only see their own data, and the Instructor filter is locked to them. Revenue charts (marked * above) only appear for staff with the matching revenue view permission for that report.
Troubleshooting:
- Unable to load report: The report could not be loaded. Click Try again.
- No report data: Nothing matches the current filters. Try a wider date range or clear some filters.
- Placeholder cards are shown while the report is loading.